Abstract
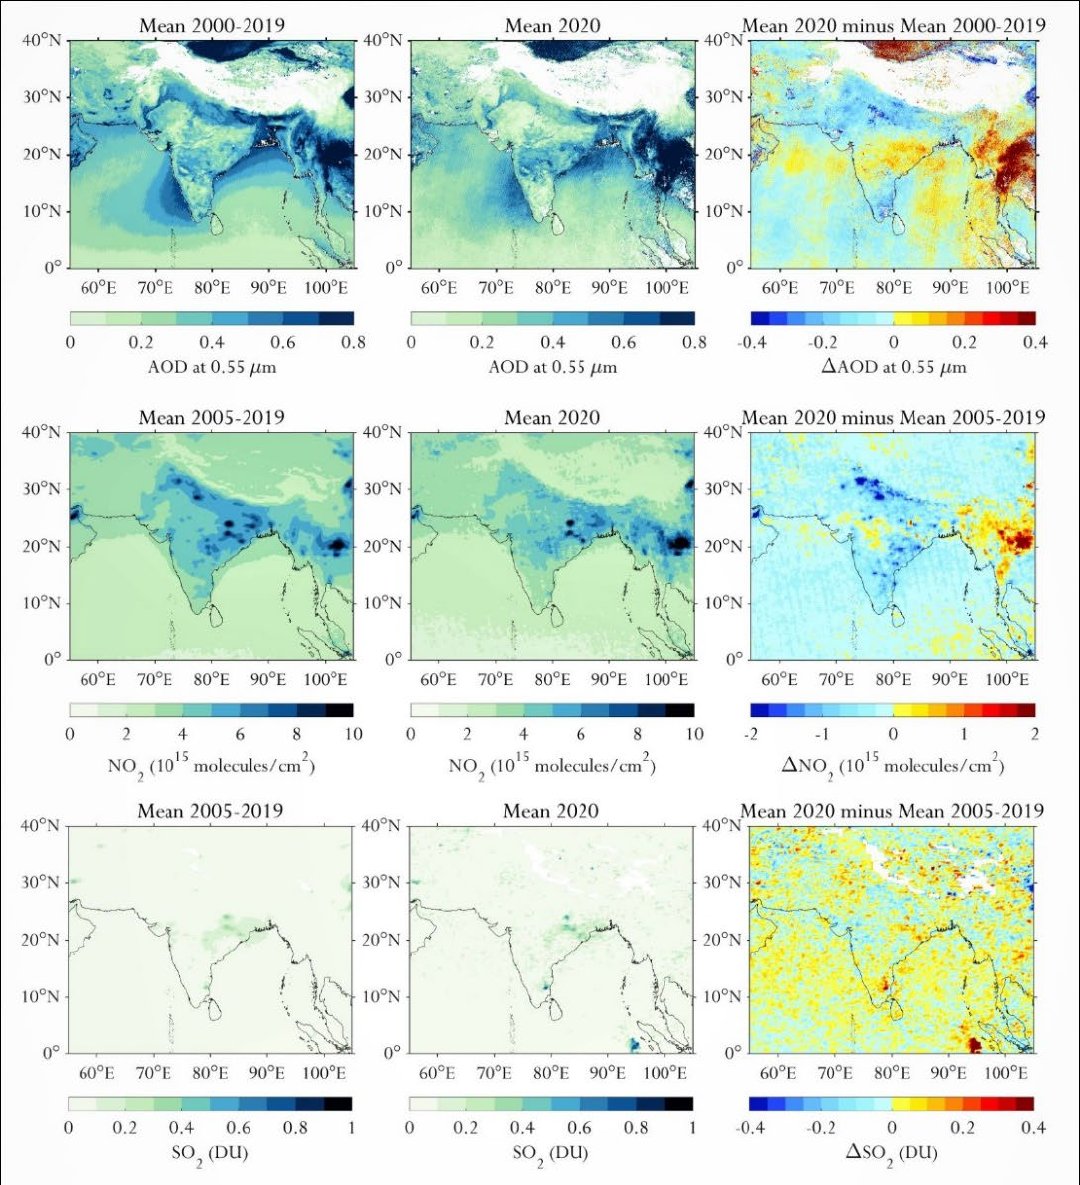
South Asia is a hotspot of air pollution with limited resilience and hence, understanding the mitigation potential of different sources is critically important. In this context the country lockdown initiated to combat the COVID-19 pandemic (during March and April 2020 that is the pre-monsoon season) provides an unique opportunity for studying the relative impacts of different emission sources in the region. Here, we analyze changes in levels of air quality species across the region during selected lockdown periods using satellite and in-situ datasets. This analysis compares air quality levels during the lockdown against pre-lockdown conditions as well as against regional long-term mean. Satellite derived AOD, NO2, and CO data indicates an increase of 9.5%, 2%, and 2.6%, respectively, during the 2020 lockdown period compared to pre-lockdown over the South Asia domain. However, individual country statistics, urban site data, and industrial grid analysis within the region indicate a more varied picture. Cities with high traffic loads reported a reduction of 12–39% in columnar NO2 during lockdown, in-situ PM2.5 measurements indicate a 23–56% percent reduction over the country capitals and columnar SO2 has an approximate reduction of 50% over industrial areas. In contrast, pollutant emissions from natural sources e.g., from biomass burning were observed to be adversely affecting the air quality in this period potentially masking expected lockdown related air quality improvements. This study demonstrates the need for a more nuanced and situation specific understanding of sources of air pollutants (anthropogenic and natural) and for these sources to be better understood from the local to the regional scale. Without this deeper understanding, mitigation strategies cannot be effectively targeted, wasting limited resources as well as risking unintended consequences both for the atmosphere and how mitigation action is perceived by the wider public.
Key figure